“printf debugging” might work for writing simple Zephyr applications, but sophisticated tools are needed as Zephyr applications grow in complexity. This guide introduces advanced debugging techniques using SEGGER Ozone and SystemView, which provide deeper insights and control for developers working with Zephyr’s Real Time Operating System (RTOS).
Table of Content
ToggleThe Need for Advanced Debugging Tools:
As developers start using Zephyr’s capabilities i.e., managing threads, semaphores, and queues, understanding the behaviors of these concepts becomes important. SEGGER’s debugging tools offer the visibility necessary to troubleshoot at a deeper level.
Setting Up the Environment:
The following hardware and software are necessary for the right setup:
- A J-Link programmer
- A development board with SWD or JTAG capabilities
- A compatible Zephyr-supported chipset or board
- SEGGER Ozone software installed on your system
Debugging with SEGGER Ozone:
Segger Ozone is known for its ability to debug any embedded application. It offers powerful debugging capabilities that are especially beneficial for Zephyr developers.

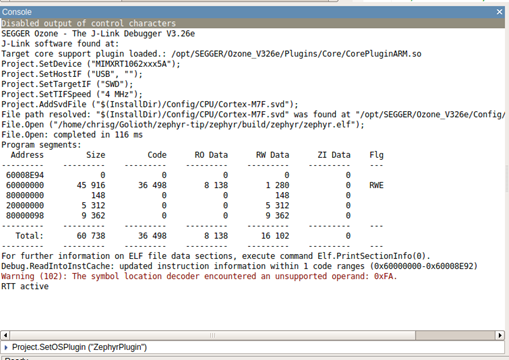
Source: Golioth.io
- Compile and Prepare Your Zephyr Application: Configure your application for debugging by enabling features that facilitate thread analysis and system traceability. Compiling your application with the right settings in the prj.conf file is crucial:
CONFIG_THREAD_NAME=y

CONFIG_SCHED_CPU_MASK=y

CONFIG_THREAD_ANALYZER=y- Configuring SEGGER Ozone: Load the compiled ELF file into SEGGER Ozone. ELF file format includes comprehensive metadata, aiding in the debugging process. Set up your project using the guided setup in Ozone, choosing the correct processor and debugger interface. Importantly, activate the Zephyr Plugin to enable thread-aware debugging. You need to run the following command in the Ozone Console:
SetOSPlugin ("ZephyrPlugin")Analyzing Real-Time Performance with SystemView:
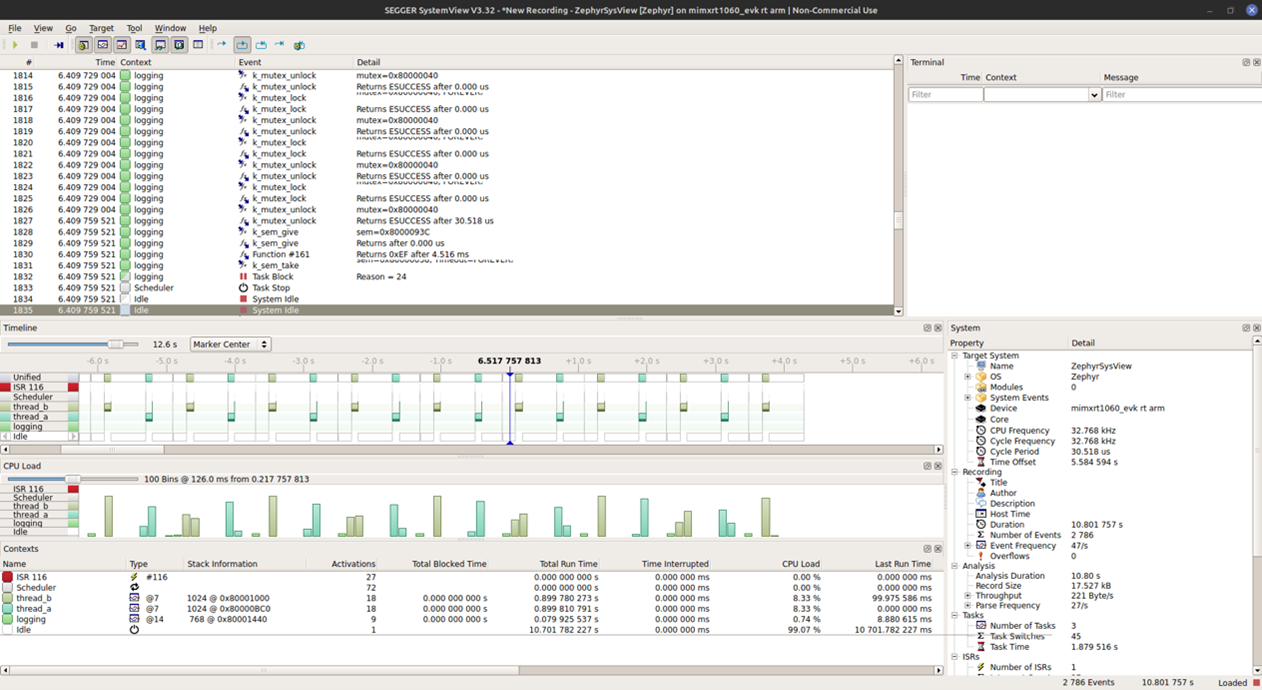
SystemView extends the debugging capabilities by providing real-time visualization of system behavior, which is very important for identifying performance bottlenecks and optimizing thread management.

Source: Golioth.io
- Enable Necessary Logging Features: Adjust your project’s configuration to support Real-Time Transfer (RTT), which is pivotal for capturing data in SystemView:
CONFIG_THREAD_NAME=y

CONFIG_SEGGER_SYSTEMVIEW=y

CONFIG_USE_SEGGER_RTT=y

CONFIG_TRACING=y

CONFIG_TRACING_BACKEND_RAM=y- Utilize SystemView for Event Capturing: With the right settings, SystemView can record and display detailed interactions and timings, providing insights into the scheduler’s decisions and thread performance.
Combining Ozone and SystemView:
Using Ozone and SystemView concurrently allows for an integrated debugging approach. Set breakpoints in Ozone and initiate SystemView recordings when these breakpoints are hit to focus your analysis on critical sections of your application.
Conclusion:
Advanced debugging tools like SEGGER Ozone and SystemView are transformative for embedded development, turning the debugging process from a challenge into a strategic advantage. These tools enable developers to better analyze application’s behavior to ensure robust, efficient, and reliable software.
If you need more details from specific sections or have additional questions, feel free to ask team Oxeltech! We are happy to support you in solving your firmware development challenges.


