
Source: embeddedcomputing
Coredump captures the crash moment of an embedded system. It shows memory, registers, and stack traces.
Firmware bugs are tricky. Hardware-software interactions are complex, resources are constrained, and runtime behavior can sometimes be unpredictable. For teams working on developing embedded products, this can feel like navigating in the dark.
To reach the core of the problem, you need to gain deeper insights into your system behavior at the precise moment of failure (especially when the system crashes). That’s where coredump comes into picture.
What is a Coredump?
A coredump is a snapshot of a program’s memory at the moment it crashes or encounters a fault. This snapshot includes the contents of memory, CPU registers, stack traces, and other critical data. It serves as a forensic artifact that allows developers to analyze what went wrong and identify the root cause of the issue.
The process of generating a coredump typically starts from a fault handler detecting a critical problem. The handler then writes relevant data to persistent storage for post-mortem analysis. This workflow transforms runtime failures into actionable insights.
Why use Coredump for Firmware Debugging?
Coredumps offer several key advantages for firmware debugging:
- System State Capture: By preserving the state of memory, registers, and the call stack at the time of failure, coredumps allow developers to analyze conditions leading to the fault.
- Fault line address: Coredumps can map the fault’s memory address to the exact line in the source code, helping pinpoint the root cause efficiently.
- Off-Device Debugging: Unlike live debugging, coredumps enable developers to analyze issues offline, reducing the need for continuous device connectivity.
- Insight into Rare Issues: Intermittent and non-deterministic bugs can be particularly challenging to debug. Coredumps provide a reliable mechanism to capture such events for analysis.
When is a Coredump Better than Breakpoints?
Many firmware developers rely on logging or breakpoints—debugging methods that struggle in critical scenarios:
- System resets: Logs often vanish if the device reboots before data is saved.
- Timing-sensitive bugs: Breakpoints alter real-time behavior, masking issues (Heisenbugs).
- Intermittent crashes: Rare or non-reproducible failures leave no trace in logs.
- Post-mortem analysis: Without a crash snapshot, root causes stay hidden.
Coredumps bypass these limitations by freezing the system’s state at the crash moment—registers, memory, stack—even if the device resets. No guesswork, no altered behavior, just hard evidence.
Core Dump Support in Modern Embedded Frameworks
Embedded frameworks are stepping up to simplify crash debugging with built-in coredump tools. Here’s how two popular platforms—Zephyr RTOS and Espressif’s ESP-IDF—make it easier to diagnose firmware failures:
Zephyr RTOS
Zephyr provides configurable core dump support, enabling developers to capture system state during fatal errors. The framework allows core dump data to be output through backends, including:
- Logging Backend: Utilizes the logging module to output core dump data, which can be retrieved via UART or RTT for analysis.
- Flash Partition Backend: Stores core dump data in a designated flash partition, allowing for retrieval and examination later.
Zephyr offers many configuration options for core dump implementation that can be adjusted according to the needs of the application. Additionally, toolchains for Zephyr include Python scripts and GDB debugger integrated, enabling developers to parse and analyze core dump data effectively.
Source: academy.nordicsemi
Espressif Framework
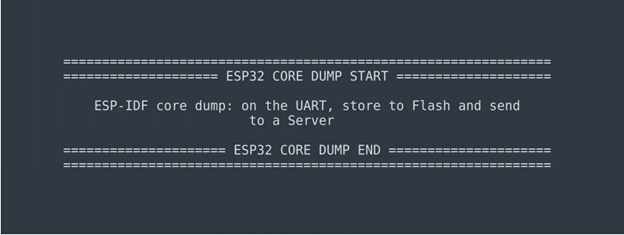
Espressif’s ESP-IDF framework, widely used for their ESP32 series, includes robust core dump capabilities. The framework captures snapshots of all tasks during a crash, including their control blocks and stacks. Core dumps can be configured to:
- Destinations: Save to flash memory or output via UART, providing flexibility for debugging.
- Formats: Use either ELF (providing detailed information) or binary formats for analysis.
Espressif also provides tools and scripts to retrieve and analyze core dumps, enhancing the debugging process significantly.
Source: medium
Adapting Coredump Techniques for Other Systems
While frameworks like Zephyr and Espressif simplify coredump implementation, the principles can be adapted for other systems without extensive manual efforts. Most modern embedded development frameworks provide some level of support or guidance for implementing coredumps, allowing developers to integrate this technique without building it from scratch.
Tools like CoreDumpARM offer a versatile solution to generate, handle, and analyze core dump files on systems based on the ARM architecture. Developers can adapt such tools to meet the specific requirements of their hardware and debugging processes.
Step-by-Step: Building a Coredump System for Embedded Debugging
Implementing coredumps in resource-constrained embedded systems requires careful planning. Here’s how to do it right:
- Fault Detection and Triggering:
The process begins with a fault handler that recognizes critical failures, such as hardware exceptions or software faults. The handler’s role is to initiate the coredump process as soon as a fault occurs.
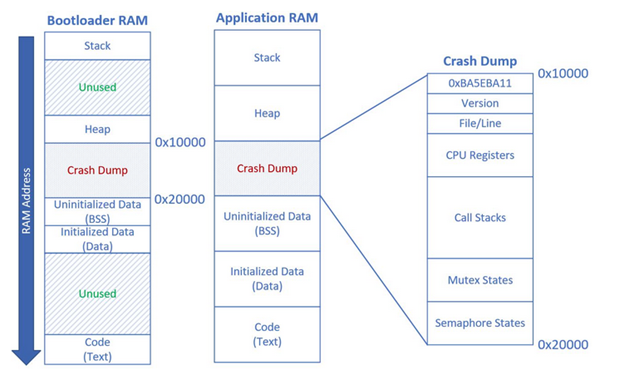
- Memory Snapshot Collection:
Capture a forensic snapshot of the system’s state at crash time:
What to include: Stack traces, CPU registers, global variables, and critical memory regions.
What to skip: Non-essential data to save space (e.g., unused RAM sections).
Tip: Prioritize data that reveals the crash’s root cause.
Source: codeproject
- Persistent Storage:
Store the snapshot reliably, even after a reset:
Flash memory: Ideal for standalone devices (but mind wear-leveling).
External storage: SD cards or EEPROM for larger dumps.
Network transmission: Stream data to a host PC via UART/WiFi (if there is connectivity).
Trade-off: Speed vs. storage capacity. Choose based on your hardware limits.
- Debugger for Analyzing Coredump
Turn raw data into actionable fixes with these tools:
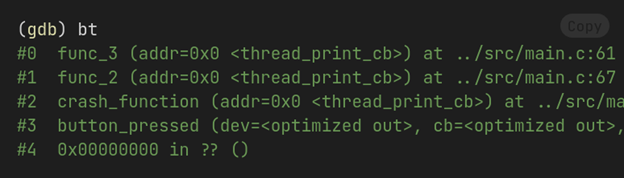
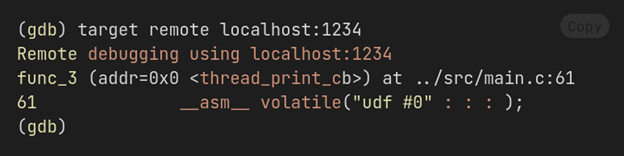
GDB: Inspect memory contents, stack traces, and variable states.
addr2line: Map crash addresses to exact source code lines (requires debug symbols!).
Visual debuggers: IDEs like VSCode or Eclipse can visualize coredumps for faster analysis.
Pro Tip: Always build firmware with debug symbols enabled during development.
Source: academy.nordicsemi
Conclusion
Coredumps capture your embedded system’s exact state at the moment of failure—memory, registers, and stack traces. This snapshot lets you pinpoint crashes to specific code lines, even if the device resets or the bug rarely occurs. While setup requires fault handlers, storage planning, and debug symbols, the result is faster fixes, fewer guesses, and reliable firmware.
Oxeltech Firmware Development Team’s Opinion: Despite their value, coredumps are underused in embedded development. Stop debugging blind. Start using coredumps.