
Source: tag-connect
Efficient debugging accelerates development. SEGGER’s J-Link debug probe stands out as a great tool for debugging embedded systems. It is suitable for both beginners and advanced developers.
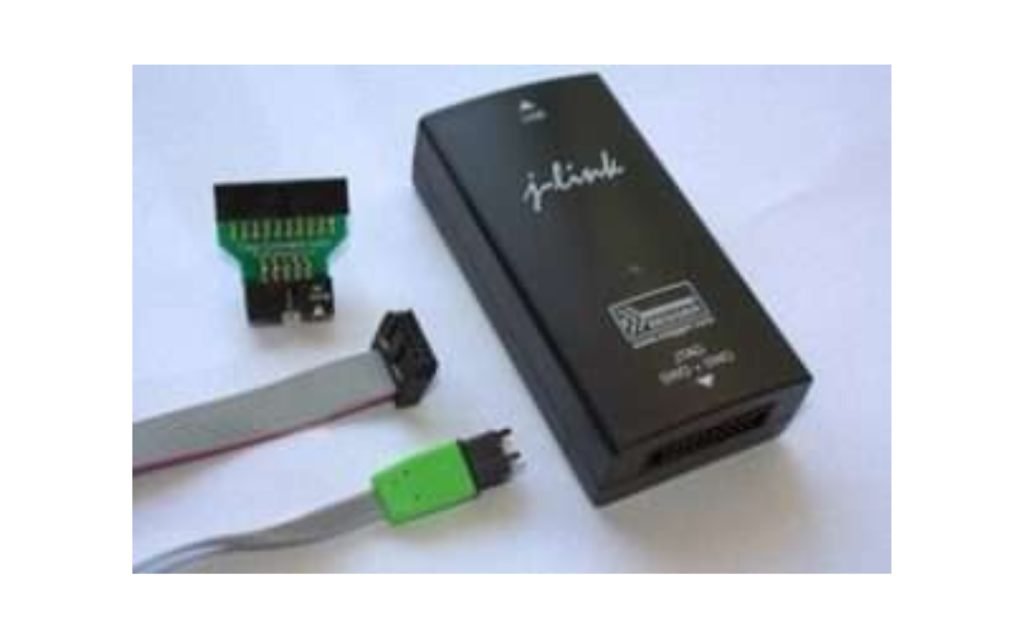
Introduction to J-Link
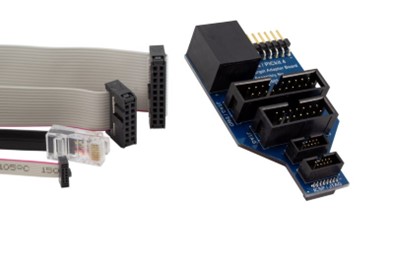
J-Link is a debug probe developed by SEGGER, providing JTAG, SWD (Single Wire Debugging), and fine-pitched ICSP interfaces.
Source: logicpower
It is recognized for its speed, and compatibility with a wide range of microcontrollers (MCUs). This includes ARM, Renesas RX, and Microchip PIC32.
Key Features of J-Link
- Broad MCU Support: J-Link is compatible with devices from over 50 vendors, covering more than 5,000 MCUs.
- High-Speed Debugging: Offers download speeds up to 1 MB/sec, reducing programming/download time.
- Cross-Platform Compatibility: Supports Windows, Linux, and macOS.
- RTOS Awareness: Can display threads, stacks, and more in real-time operating systems. This provides a deeper insight into application behavior.
Benefits of Using J-Link
- Reliability: Engineered for stability under load, reducing the likelihood of crashes during critical debugging sessions.
- Ease of Use: Simple setup with automatic speed detection and an intuitive interface.
- Advanced Breakpoint Management: Allows setting an unlimited number of breakpoints in flash memory. This makes the debugging of complex software easier.
- Scriptable: The J-Link scripting language enables automation of routine tasks, saving developer’s time.
Integrating J-Link into Development Workflows
J-Link integrates effortlessly with popular IDEs like Keil MDK, IAR EWARM, and Eclipse-based environments. Here’s a quick guide on how you can set up J-Link for a typical project:
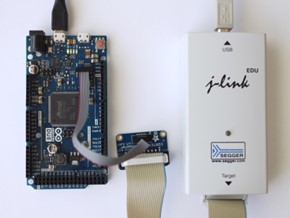
- Connecting J-Link: Connect J-Link to your PC via USB and to your target device through its debug interface.
Source: embeddedcomputing
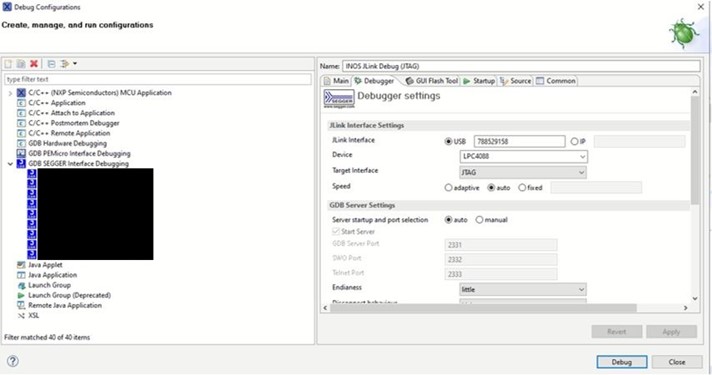
- Setting Up the IDE: Configure your IDE to use J-Link. This usually involves selecting J-Link as the debug probe in the project settings.
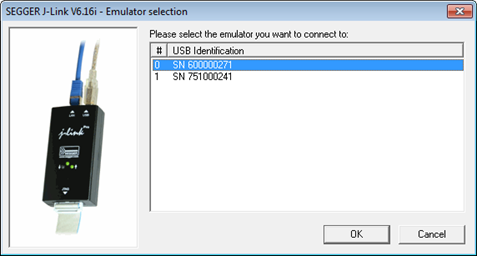
Source: https://wiki.segger.com/Multiple_J-Links_at_the_same_PC
- Launching a Debug Session: With the press of a button, you can start debugging. J-Link communicates with your target device, allowing you to step through code, set breakpoints, and watch variables.
J-Link Applications
- Firmware Debugging: Developers rely on J-Link to troubleshoot and refine firmware written for embedded devices.
- Production Flash Programming: Beyond debugging, J-Link is also used in production environments for efficient flash programming of devices.
Summary
SEGGER’s J-Link is a useful tool in embedded systems development and troubleshooting. J-Link can be used whether you’re debugging a complex ARM-based RTOS application or programming a simple microcontroller. It’s our favorite microcontroller debugging tool due to its speed and support for a wide range of microcontrollers.
Facing challenges with embedded debugging tools or electronic product development in general? Feel free to Contact Us for hardware design, driver development, and firmware expertise.